| |
Contents | EBJ Home | Single molecule measurements and biological motors |
To illustrate what is possible with this technology, we present some example images and animations from our own research. We perform both prism-style (for in vitro experiments) and objective style (for cell experiments).
 |
||
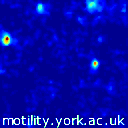
| Cy3-EDA-ATP binding to myosin | ||
 |
||
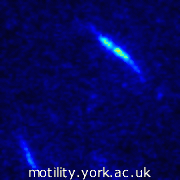
| Actin filaments diffusing in the evanescent wave. | ||
The animation on the right is a demonstration of the properties of the evanescent wave. Actin filaments were labelled with Rhodamine phalloidin and added to a flow cell where they were visualised by TIRF. The very shallow penetration depth is evident from the way the filaments "flicker" as they diffuse up and down in the evanescent wave. This also illustrates the flexibility of the actin filaments.
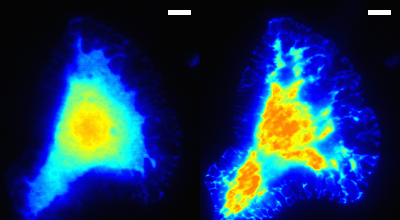
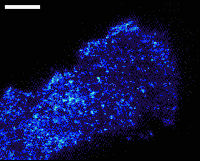
One of the most exciting possibilities with TIRF is the ability to visualise single molecules in living cells. Here we illustrate how TIRF allows us to focus on the parts of the cell which are near to the surface, and to detect and monitor single molecules in this region.
 |
| Comparison of epifluorescence (left) vs. TIRF. The same cell (a myoblast) is visualised by the two techniques. The cell has been transfected with a construct expressing a myosin I GFP fusion construct. Note the greater detail of the structures in the cellular lamella visible in the TIRF image. Scale bar: 10 μm. Click on image for full size version. |
 |
| This image is a still from a video showing the visualisation of single molecules in a living cell. Shown is the lamellar region of a myoblast expressing a myosin X pleckstrin homology domain GFP fusion protein. As the initially high background bleaches, discrete spots become visible. Note how these spots appear and disappear as the individual molecules bind to the membrane, are released, or possibly photobleach. Scale bar: 10 μm. Click on image for full-size AVI file. |
| Contents | Next |