| |
Contents | EBJ Home | Single molecule measurements and biological motors |
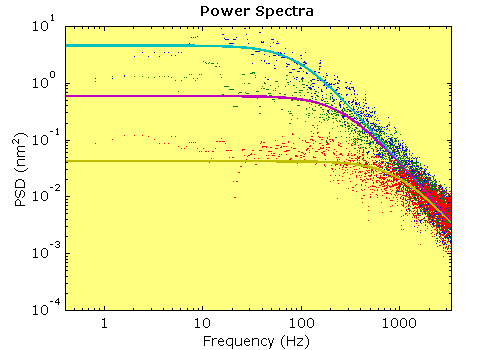
The power spectrum of the motion of a trapped bead is a useful means of describing its behaviour over time. In fact it translates the motion from the time domain into the frequency domain. It can be shown that the power spectrum of the motion of a trapped bead is described by a Lorentzian curve. If we record the behaviour of a trapped bead and then plot the power spectrum, we would expect to see a Lorentzian curve. Deviations from, or distortions of this curve, indicate some form of non-ideal behaviour in the system, e.g. noise in the electronics, or pointing instability in the laser. By fitting a Lorentzian curve to the power spectrum, we can also estimate some of the properties of the system.
There are several ways of writing the equation for the Lorentzian. We find the most intuitive way is to express it in terms of the corner frequency f0, and asymptotic power, S0:
S(f)=S0f02/(f02+f2)
where f is the frequency. We can then estimate the parameters either by curve fitting to a calculated power spectrum or (more crudely) by eye.
The key parameter we would obtain from a curve fit is the corner or “roll-off&” frequency, f0, which is the frequency where the power of the thermal motion has dropped to half the asymptotic value. If we know the drag coefficient of the trapped bead, we can derive the trap stiffness from this parameter:
f0 = κ/2·π·γ
To be able to characterise the properties of the system in this way, we need to ensure that the sampling frequency which we use is higher than the corner frequency. The corner frequency for typical trapping experiments is in the range of a few hundred Hertz to 1 kHz. Ideally therefore, we want to use a sampling frequency of several kHz. This applies both if we want to do a power spectral analysis and if we want to use the thermal motion of the system to indicate changes in system stiffness caused by the binding of a motor protein. We also need to observe the system for a sufficient length of time; the parameter here is the relaxation time which is given by κ/γ or 1/2πf0. Again this applies both to measuring the power spectrum and to determining the system stiffness from the variance. Typical single molecule recordings are (at least) hundreds of ms in length; however, this can create problems when trying to detect shorter interactions.
 |
Calculated Power Spectra of trapped
beads. The power spectra of three records at different laser powers,
shown previously using the same colours.
The dots show the calculated power spectra, and the solid lines, the corresponding
Lorentzian fits. The power spectra have been filtered for clarity. Note
that the Lorentzian shape describes the data well. As laser power (and thereby
trap stiffness) increases, there are several linked changes in the power
spectrum:
|
| Contents | Next |