| |
Contents | EBJ Home | Single molecule measurements and biological motors |
For most optical tweezers applications, it is necessary to be able to measure the stiffness of the optical trap. Usually it is only necessary to characterise the linear portion of the trap, where most experimental work is done. It is worth noting that the trap stiffness will depend on:
Given the large number of variables, it is generally advisable to make empirical measurements. These can be made by several methods and cross-checked for accuracy.
Here we present a brief summary of different approaches to measuring trap stiffness. These can be divided into passive methods, which simply use observations of the behaviour of the trapped object over time to deduce the trap stiffness, and active methods, where the microscope stage or the trap is moved and the response of the object is analysed. For more details, see Svoboda and Block (1994), Simmons et al. (1996) and Visscher et al. (1996).
This method was described and illustrated previously in this figure. Essentially it involves monitoring the thermal motion of a trapped bead and then calculating the variance. The trap stiffness can then be calculated:
κ = kT/<x2>
where <x2> is the variance. One advantage of this method is that it is not necessary to know the drag coefficent of the bead. However it is essential that the detector used has sufficient bandwidth to cover the full frequency range of thermal motion. The detector must also be accurately calibrated, since any errors in calibration will be squared. Furthermore, the signal to noise ratio must be high since any additional noise will increase the variance of the signal. Finally, the bead's motion must be only in the linear region of trap, although in practice, even at low trap stiffness nonlinearities are not evident (see figure).
This method is described in more detail elsewhere. Briefly, the power spectrum of the bead's motion is calculated, and a Lorentzian fitted to the data. The corner frequency, f0, of the Lorentzian can be used to calculate the trap stiffness if the drag coefficient of the bead is known. It is not necessary for the detector to be calibrated, but if it is we can also obtain the variance from the power spectrum. This method can also be used for detector calibration. Finally, the power spectrum will often show up any problems with the instrument, particularly noise.
These methods work by imposing a force (typically by moving the stage) or a displacement (by moving the trap) on the trapped bead and observing its response.
The escape force is the minimum force necessary to remove the bead from the trap. This is related to the trap stiffness, but not in a simple way, as it depends on the diameter and force profile of the trap. It is also difficult to measure accurately. For this reason, it has generally been replaced by the methods of trap stiffness measurement described elsewhere on this page. The method is usually performed by moving the stage so that fluid flow exerts a viscous force on the trapped object, and increasing the velocity until the bead escapes. If the drag coefficient is known, then the force can be calculated.
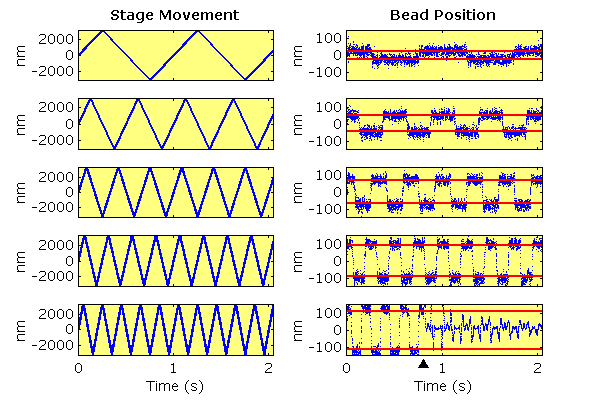
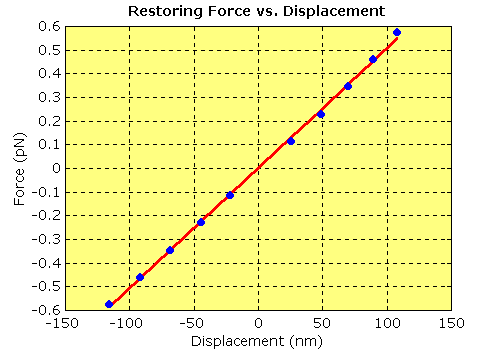
This method works by exerting a known force on the bead and measuring the displacement produced. By using a series of forces, a displacement vs. force plot can be produced and the stiffness (or gradient) can then be found by a least-squares fit. As with the previous method, known forces are generated by moving the stage at a known velocity past a trapped object, so this method requires that the drag coefficient is known. The calibration of the piezoelectric stage and the detector must both be accurate. The bead will also undergo thermal motion during the experiment, so averaging is necessary to remove the thermal component. This method can in principle be used to extend the force profile beyond the linear region of the trap, but in practice the beads tend to escape easily in this region, as shown in the example below. The example shows a triangle wave, but a sine wave could also be used.
 |
| Measuring Trap Stiffness One way to measure trap stiffness is to exert a known force on the trapped object and measure its displacement from the trap centre. One method is to use viscous drag, by imposing a triangle wave motion on the sample chamber using a piezoelectric stage. In a triangle wave, the stage is moving at a constant velocity except when it changes direction; a triangle wave of motion becomes a square wave of force, which gives a square wave of displacement. If we know the drag coefficient of the trapped object we can then calculate the force and derive the trap stiffness. In the above plot, the left hand panels show the imposed triangle wave motion with amplitude 3 μm and frequencies of 1,2,3,4 and 5 Hz respectively. The right hand panels show the corresponding motion of a trapped 1 μm polystyrene bead. Note how as the frequency of the forcing function increases, the stage velocity, and thereby the corresponding force and displacement increase. At the highest frequency, the bead escaped from the trap, at the time indicated by the black triangle. The mean positive and negative displacements are shown by the red lines. Imposed on the square wave motion is the normal thermal motion of the trapped bead. |
 |
| Restoring Force vs. Displacement derived from the data in the previous plot. The restoring force on a bead in an optical trap is given by F = κ·x. The data points show the mean positive and negative displacements at the different imposed force levels. The red line is a least squares fit giving a slope (the trap stiffness, κ) of 0.005 pN·nm-1. The area under this line gives the potential energy at a given displacement. At higher displacements this relationship becomes non-linear as the bead reaches the edge of the trap. |
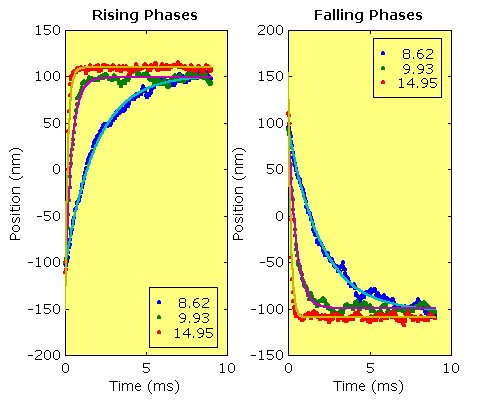
This method works by imposing a displacement on the bead by moving the trap rapidly using the AODs. The bead returns to the centre of the trap on an exponential time course. Finding the rate constant of this exponential will, if the drag coefficient is known, enable the trap stiffness to be calculated. Calibration of the detector is not required, although in principle this method could be used as a form of calibration. The trap motion must be rapid compared to the relaxation time (γ/κ) of the bead. The detector bandwidth, and the sampling frequency used, must be sufficiently high to observe the rapid time-course of the bead's motion.
The response of the bead remains exponential as long as the displacement occurs within the linear region of the trap. Larger displacements can be used to map the force profile beyond the linear region by differentiating the bead motion (Simmons et al., 1996).
Similarly the response of the bead to AOD sinusoids of different frequencies, or to a swept-frequency "chirp", could also be used to characterise the trap stiffness.
 |
| Trap Stiffness: Step response analysis. These traces show the averaged step responses from the previous figure (dots). The averaging removes much of the thermal noise. The time courses of both upward and downward steps are exponential curves. The rate constants derived from exponential fits (solid lines) can then be used to estimate the trap stiffness if the drag coefficient of the bead is known. The values obtained from these fits were 0.0048, 0.0220 and 0.0579 pN·nm-1 respectively, giving an approximately linear relationship to the diode current. |
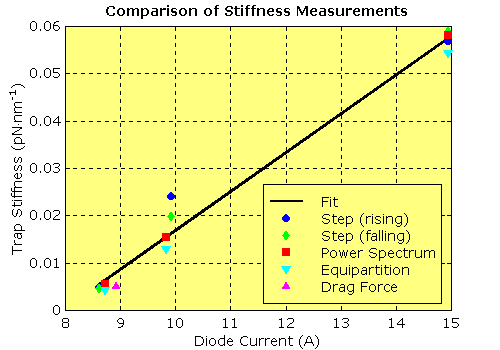
Although all the above methods have pros and cons, if the apparatus is working correctly and well calibrated, all should produce similar results. It is worth cross-checking with several methods to ensure that everything is working well (and that data analysis is correct!). The following plot summarises the results of the examples shown previously of the equipartition, power spectrum, drag force and step response methods. Overall, the agreement is excellent.
 |
| Contents | Next |