| |
Contents | EBJ Home | Single molecule measurements and biological motors |
TIRF or evanescent wave microscopy is a form of fluorescence microscopy where the excitation light is largely confined to a very small volume close to a surface. It has many applications; in addition to single molecule fluorescence, it is useful for imaging many processes that occur near the cell membrane and also for measuring distances of objects with high resolution in the z-axis. Before we discuss the applications, it will be useful to present a brief overview of the optical theory behind this technique.
 |
|
||||||||||||||
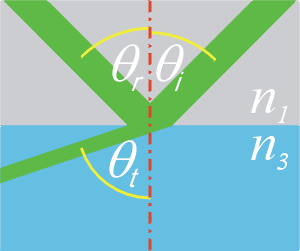
| Cartoon of reflection and refraction at an interface. See table for definitions of symbols. | |||||||||||||||
Total Internal Reflection (TIR) is a phenomenon that may occur when a beam of light passes from an optically denser medium into a less dense medium. This is the effect you can sometimes see when holding a glass of water; the inside of the glass seems silvery, but your fingerprints are clearly visible. To understand why, letís quickly review the relevant optics (see Hecht (2001) for a good optics text).
Let us consider the general case of a ray of light encountering the interface between two media of differing refractive indices. What happens at the interface is primarily determined by the two refractive indices (n1 and n3, respectively) and the angle of incidence of the ray (θi). In most cases, part of the energy of the incident beam is reflected from the interface, and part of it is transmitted through it. We are interested in knowing what are the intensities and angles of these reflected and transmitted rays.
The simplest case is where n3 > n1, which is known as external reflection. The angle of the reflected ray, θr, is equal to the angle of incidence (θr = θi). The angle of the transmitted or refracted ray is given by Snellís law:
n1 · sin θi = n3 · sin θt
At perpendicular incidence, the majority of the intensity is in the transmitted ray; at glancing incidence, it is mostly in the reflected ray.
The converse case, where n3 < n1, is known as internal reflection and shows some interesting properties. Let us first consider the angles of the rays, as shown in the plot. The angles of the reflected and transmitted rays are shown on the plot. The first point to make is that the same mathematical relationships hold for internal reflection as for external reflection. As can be seen from the green line, the angle of the reflected ray equals the angle of the incident ray. The blue line shows the angle of the transmitted ray as determined by Snellís law. The angle of the transmitted ray is always greater, i.e. the ray always bends away from the normal (except at normal incidence). The striking thing about the plot is that the angle of the transmitted ray reaches 90° before the incident angle does. At this point there is a discontinuity and the calculated angle remains at 90°. Physically this seems reasonable, because the transmitted ray cannot exceed 90° without re-entering the first medium. (Beyond the discontinuity the angle becomes a complex number Ė we have simply plotted the real component).
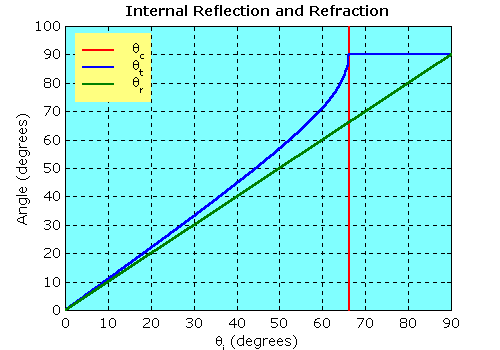 |
| Plot of angles of reflected and transmitted rays vs. angle of incidence. The media are quartz (n1 = 1.46) and water (n3 = 1.33). |
But what is really happening at this point?
We can understand what is going on by looking at the intensities of the reflected and transmitted rays. In this plot, the reflectance and transmittance are plotted for the same scenario as above. Although there are subtle differences in the intensities for different polarisations of the incoming light, it can be seen in both cases that at the same angle as the previous plot, the transmitted intensity rapidly drops to 0 and the reflected intensity rises to 1. In other words, at angles greater than this critical angle, all the light is reflected Ė hence the term total internal reflection.
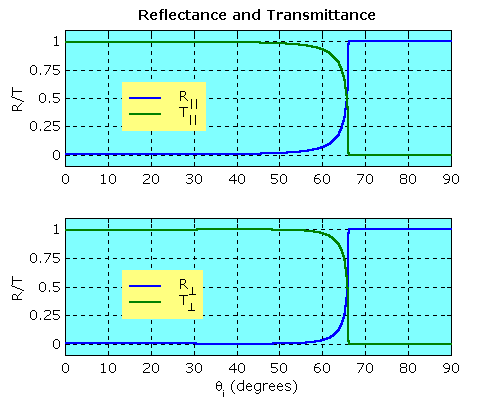 |
| Reflectance and Transmittance for internal reflection at quartz Ė water interface. R, the reflectance, is the ratio of reflected to incident intensity; T is the transmittance or the ratio of the transmitted to the incident intensity. The subscripts refer to light polarised parallel (||) and perpendicular (⊥) to the plane of incidence. At θi > θc, TIR occurs. |
The critical angle can readily be calculated using Snellís Law. Remember that the critical angle is the angle of incidence at which the transmitted ray emerges at 90°. By rearranging the equation for Snellís law given previously, we get:
sin θi = (n3/n1) ∑ sin θt
If† θt =† 90° then sin θt = 1 and therefore sin θc = (n3/n1). For example, in the accompanying figures, the example used is the interface between quartz (n1 = 1.46) and water (n3 = 1.33), where the critical angle is 65.6°.
So far we have discussed some fairly general optical principles. But how is this phenomenon useful in microscopy, particularly single molecule microscopy? The answer will be evident from a closer examination of what occurs at the interface at or beyond the critical angle: the formation of the so-called evanescent wave.
If all of the light is reflected, and does not enter the specimen chamber, how can this phenomenon be useful for fluorescence microscopy? The following cartoon illustrates what happens at the point where a beam of light is totally internally reflected at the interface between the two media. Where the angle of incidence is greater than the critical angle, some of the incident energy does indeed penetrate into the second medium. Here it forms an electromagnetic field that oscillates with the same frequency as the incident light. But this energy then passes back into the first medium to form the reflected ray Ė unless it is absorbed. The evanescent wave can be absorbed, or excite fluorescence, in the same way as the incident light. However, the evanescent wave has some additional, very useful, properties.
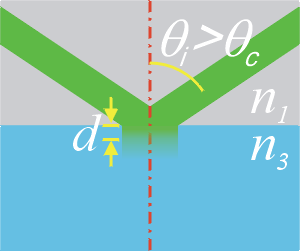 |
| Schematic of TIR. Where θi > θc, all the energy enters the reflected ray. At the interface, an evanescent wave is generated, which penetrates a characteristic distance d into the medium. |
The chief distinction of the evanescent wave is that it penetrates for only a very short distance into the medium. In fact, it decays exponentially as it moves away from the surface. This means that fluorescence is only excited within a very small volume. It is therefore very useful for looking at events near to a surface, and furthermore, there is a very low background of out-of-focus fluorescence (compared to other techniques such as epifluorescence). It is primarily this latter advantage which makes it useful for looking at single molecules. Another advantage of using TIR is that the excitation light, which can also contribute to background (as it is usually much more intense than the fluorescence) is cleanly removed from the observation chamber, as any that is not absorbed (or scattered) is carried away in the reflected beam. Another way in which the evanescent wave can be used is as a very precise ruler. The position of a fluorescent object on the z-axis can be deduced from the intensity of the fluorescence.
It is useful to understand the properties of the evanescent wave in some detail. The plots below provide illustrations of the key features; for the equations used to calculate them see Axelrod (1989) and Axelrod et al. (1992).
Somewhat counterintuitively, the intensity of the evanescent wave can actually be greater than the incident intensity. The following plot illustrates the intensity measured at the interface as a function of the angle of incidence. As can be seen from the blue trace, the intensity is close to 1 at angles greater than the critical angle. Near the critical angle, it increases steeply, peaking at the critical angle and then falling off again rapidly towards 0 at 90°.
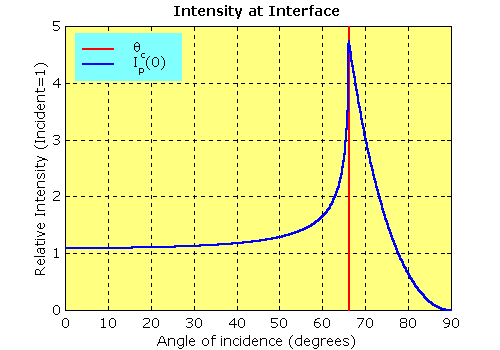 |
| Intensity vs θi for a quartz-water interface. Ip(0) refers to the p polarised intensity at z = 0, where z is the distance from the interface. The plot for the s polarised component is of a similar shape, but slightly lower intensity. |
As the following plot shows, the intensity is also dependent on the polarisation of the incident light.
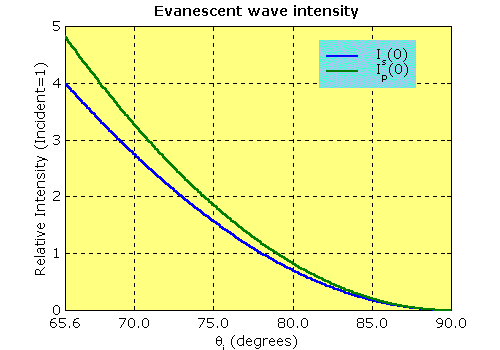 |
| Intensity vs. θi as in the previous plot, but focussing on θi > θc and showing both s and p components. |
The intensity of the evanescent wave shows an exponential decay. The intensities for s and p-polarised light are shown. The penetration depth of the wave is characterised by the parameter d, the depth at which the intensity is 1/e times that at the interface. Its value is typically of the order of the wavelength of the incident light, and is also, as the second plot shows, dependent on the angle of incidence; the penetration is much higher at angles which just exceed the critical angle.
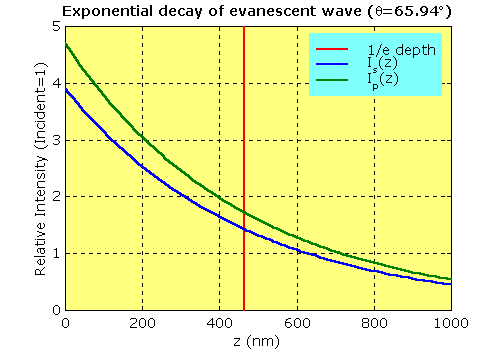 |
| Intensity vs. z for 532 nm (green) light. |
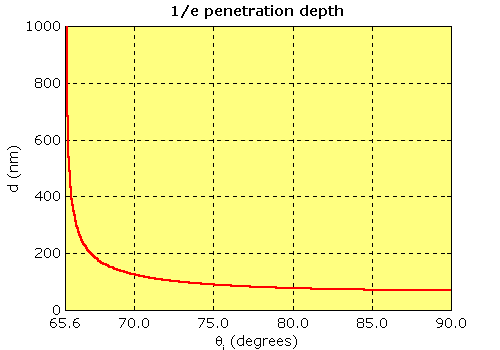 |
| Depth d vs. θi at 532 nm. |
This surface plot summarises the effects of the angle of incidence and the distance from the interface on the intensity of the evanescent wave.
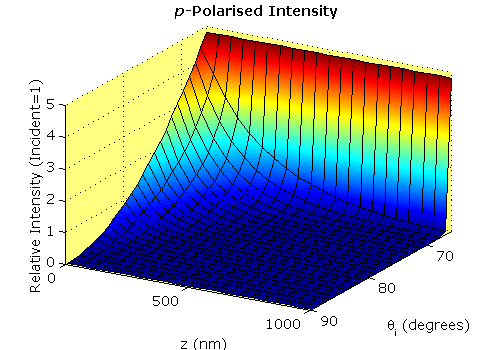 |
| Summary plot. Summary of intensity for 532 nm light at a quartz-water interface. |
| Contents | Next |