Calibration
An important issue in making single molecule measurements is precise calibration
of position detectors (such as quadrant
photodiodes) and active components such as piezoelectric
stages and acousto-optic deflectors. There are many
different ways of calibrating a setup, but a typical calibration chain might
work as follows:
- A stage micrometer or graticule is used to calibrate the magnification of
the video images. Typically this would give x and y calibrations
in nm per pixel (most video equipment has a nonunit aspect ratio).
- The piezoelectic stage motion is then calibrated against the video, e.g.
using the stage micrometer. If the stage is not feedback controlled, non-linearities
and hysteresis will need to be taken into account. This should give a calibration
in nm/V or nm/bit.
- The AODs are also calibrated against the video image. For example, a trapped
bead can be moved across the field of view and its position measured in video
pixels. Again a calibration in nm/V or nm/bit should be obtained.
- The detector can then be calibrated against the active components. Ideally
the calibration between the stage and AODs should be cross-checked. The linearity
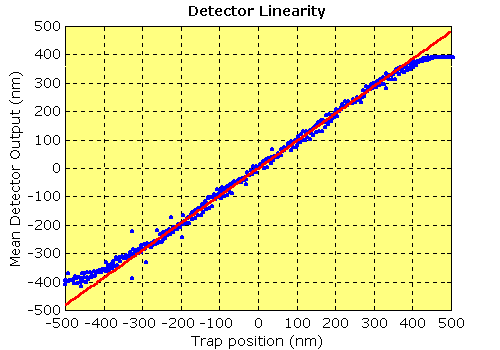
of the detector can also be characterised at this time. Typically the detector's
linear range is sufficient for most work; the nonlinearities do not need to
be taken into account. The x and y calibrations should be similar
and again be in nm/V or nm/bit.
- to calibrate against stage motion, a bead immobilised by being stuck
to the cover slip or in an acrylamide gel is used. Typically a stage triangle
wave would then be used. This method has the advantage that it will work
with detectors that measure position relative to the trap, as well as
with imaging detectors. However since the object is not actually trapped,
careful focus adjustment may be necessary to ensure the same detector
sensitivity.
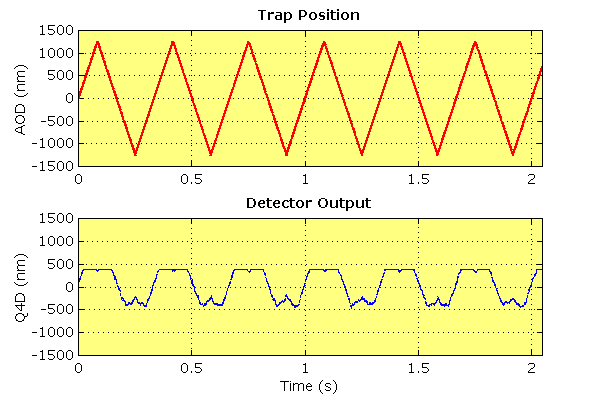
- To calibrate against trap motion, a trapped bead is moved, typically
in a triangle wave (see example below). This will
work with imaging detectors, but not those that measure position relative
to the trap.
Additionally, the power spectrum can be used
to provide an independent calibration method, i.e. one that is not dependent
on the stage or AOD calibrations.
 |
| AOD Triangle wave used to calibrate or cross-check
detector. The upper panel shows the input waveform, a 1.25 μm, 3 Hz
triangle wave imposed on the trap position. The lower panel shows the detector
response with a 1 μm bead in the trap. Note that the low frequency
ensures that the effect of viscous drag on the bead position is minimised,
so that there is negligible hysteresis in the detector response. Ideally
also the measurement is made at high trap stiffness to minimise the thermal
motion of the bead. The amplitude used deliberately exceeds the linear range
of the detector (see next figure). |
 |
| Linearity of Quadrant Photodiode detector. This
plot shows the analysis of the records in the previous
figure. The detector response over 1000 nm of trap motion is shown,
with successive cycles averaged together to reduce the effect of thermal
motion and other noise sources. The detector shows good linearity over approximately
the central 600 nm of the range; a linear fit to this portion of the
data confirms that the detector and AOD calibrations cross-check correctly.
|

